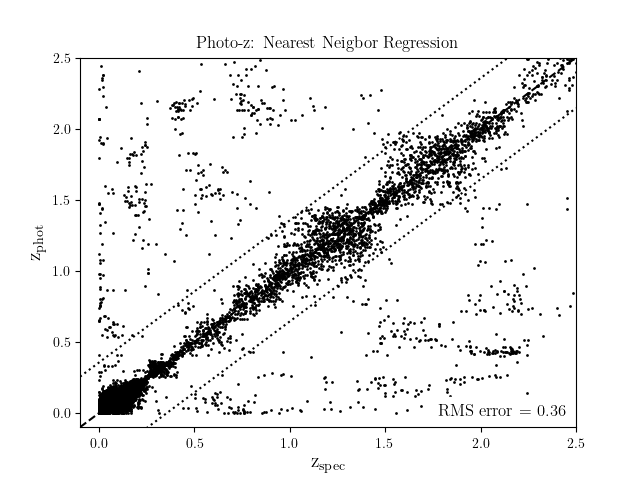
K-Neighbors for Photometric Redshifts
Estimate redshifts from the colors of sdss galaxies and quasars. This uses colors from a sample of 50,000 objects with SDSS photometry and ugriz magnitudes. The example shows how far one can get with an extremely simple machine learning approach to the photometric redshift problem.
The function fetch_sdss_galaxy_colors() used below actually queries
the SDSS CASjobs server for the colors of the 50,000 galaxies.
RMS error = 0.28
# Author: Jake VanderPlas <vanderplas@astro.washington.edu>
# License: BSD
#   The figure is an example from astroML: see http://astroML.github.com
import numpy as np
from matplotlib import pyplot as plt

from sklearn.neighbors import KNeighborsRegressor

from astroML.datasets import fetch_sdss_galaxy_colors
from astroML.plotting import scatter_contour

n_neighbors = 1

data = fetch_sdss_galaxy_colors()

N = len(data)

# shuffle data
np.random.seed(0)
np.random.shuffle(data)

# put colors in a matrix
X = np.zeros((N, 4))
X[:, 0] = data['u'] - data['g']
X[:, 1] = data['g'] - data['r']
X[:, 2] = data['r'] - data['i']
X[:, 3] = data['i'] - data['z']
z = data['redshift']

# divide into training and testing data
Ntrain = N // 2
Xtrain = X[:Ntrain]
ztrain = z[:Ntrain]

Xtest = X[Ntrain:]
ztest = z[Ntrain:]

knn = KNeighborsRegressor(n_neighbors, weights='uniform')
zpred = knn.fit(Xtrain, ztrain).predict(Xtest)

axis_lim = np.array([-0.1, 2.5])

rms = np.sqrt(np.mean((ztest - zpred) ** 2))
print("RMS error = %.2g" % rms)

ax = plt.axes()
plt.scatter(ztest, zpred, c='k', lw=0, s=4)
plt.plot(axis_lim, axis_lim, '--k')
plt.plot(axis_lim, axis_lim + rms, ':k')
plt.plot(axis_lim, axis_lim - rms, ':k')
plt.xlim(axis_lim)
plt.ylim(axis_lim)

plt.text(0.98, 0.02, "RMS error = %.2g" % rms,
         ha='right', va='bottom', transform=ax.transAxes,
         bbox=dict(ec='w', fc='w'), fontsize=12)

plt.title('Photo-z: Nearest Neigbor Regression')
plt.xlabel(r'$\mathrm{z_{spec}}$', fontsize=14)
plt.ylabel(r'$\mathrm{z_{phot}}$', fontsize=14)
plt.show()