Corrected Spectra
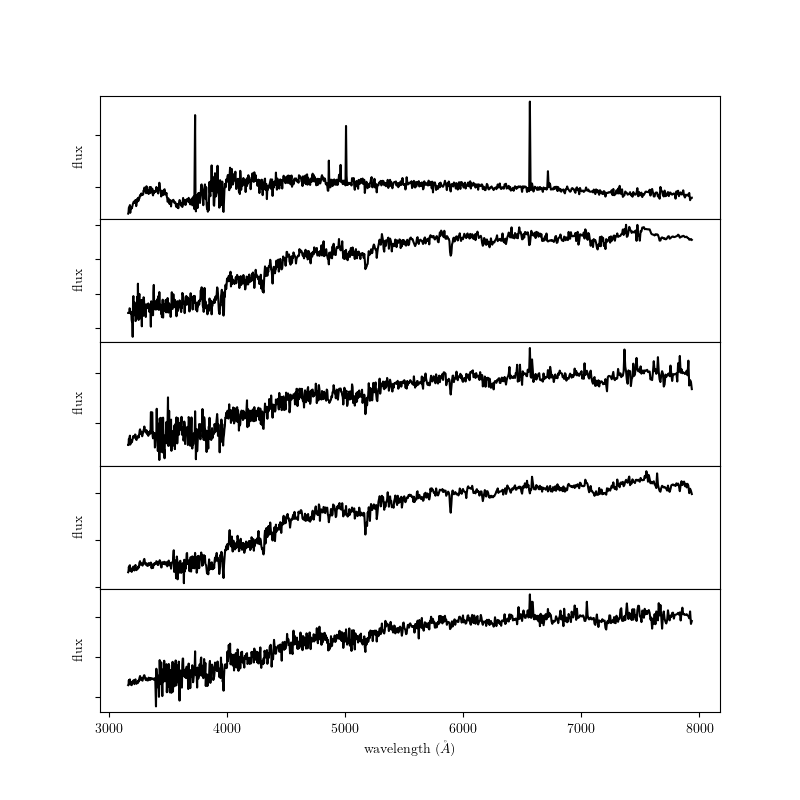
The script examples/datasets/compute_sdss_pca.py uses an iterative PCA technique to reconstruct masked regions of SDSS spectra. Several of the resulting spectra are shown below.
# Author: Jake VanderPlas <vanderplas@astro.washington.edu>
# License: BSD
#   The figure is an example from astroML: see http://astroML.github.com
import numpy as np
import matplotlib.pyplot as plt

from astroML.datasets import sdss_corrected_spectra

#------------------------------------------------------------
# Fetch the data
data = sdss_corrected_spectra.fetch_sdss_corrected_spectra()
spectra = sdss_corrected_spectra.reconstruct_spectra(data)
lam = sdss_corrected_spectra.compute_wavelengths(data)

#------------------------------------------------------------
# Plot several spectra
fig = plt.figure(figsize=(8, 8))

fig.subplots_adjust(hspace=0)

for i in range(5):
    ax = fig.add_subplot(511 + i)
    ax.plot(lam, spectra[i], '-k')

    if i < 4:
        ax.xaxis.set_major_formatter(plt.NullFormatter())
    else:
        ax.set_xlabel(r'wavelength $(\AA)$')

    ax.yaxis.set_major_formatter(plt.NullFormatter())
    ax.set_ylabel('flux')

plt.show()