SDSS Filters
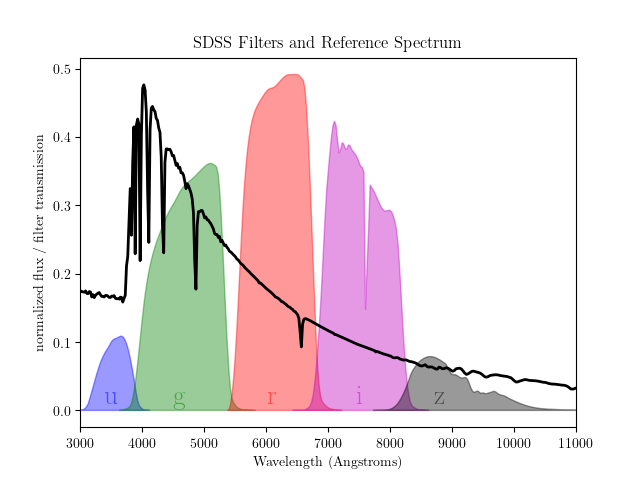
Download and plot the five SDSS filter bands along with a Vega spectrum. This data is available on the SDSS website (filters) and on the STSci website (Vega).
# Author: Jake VanderPlas <vanderplas@astro.washington.edu>
# License: BSD
#   The figure is an example from astroML: see http://astroML.github.com
from matplotlib import pyplot as plt
from astroML.datasets import fetch_sdss_filter, fetch_vega_spectrum

#------------------------------------------------------------
# Set up figure and axes
fig = plt.figure()
ax = fig.add_subplot(111)

#----------------------------------------------------------------------
# Fetch and plot the Vega spectrum
spec = fetch_vega_spectrum()
lam = spec[0]
spectrum = spec[1] / 2.1 / spec[1].max()
ax.plot(lam, spectrum, '-k', lw=2)

#------------------------------------------------------------
# Fetch and plot the five filters
text_kwargs = dict(fontsize=20, ha='center', va='center', alpha=0.5)

for f, c, loc in zip('ugriz', 'bgrmk', [3500, 4600, 6100, 7500, 8800]):
    data = fetch_sdss_filter(f)
    ax.fill(data[0], data[1], ec=c, fc=c, alpha=0.4)
    ax.text(loc, 0.02, f, color=c, **text_kwargs)

ax.set_xlim(3000, 11000)

ax.set_title('SDSS Filters and Reference Spectrum')
ax.set_xlabel('Wavelength (Angstroms)')
ax.set_ylabel('normalized flux / filter transmission')

plt.show()