RR-Lyrae Magnitudes
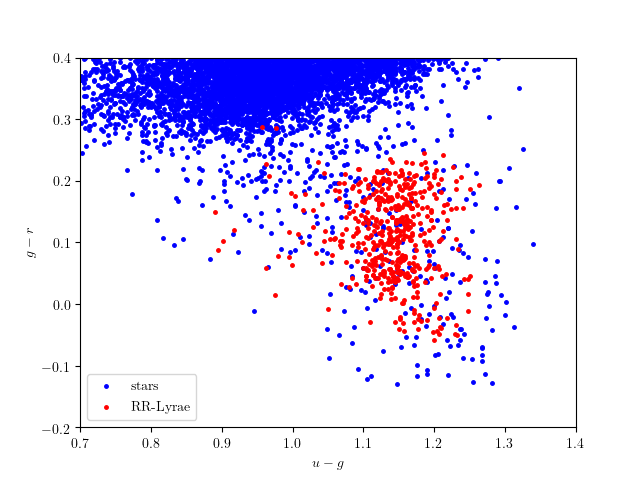
This example downloads and plots the colors of RR Lyrae stars along with those of the non-variable stars. Several of the classification examples in the book figures use this dataset.
# Author: Jake VanderPlas <vanderplas@astro.washington.edu>
# License: BSD
#   The figure is an example from astroML: see http://astroML.github.com
import numpy as np
from matplotlib import pyplot as plt

from astroML.datasets import fetch_rrlyrae_combined

#----------------------------------------------------------------------
# get data and split into training & testing sets
X, y = fetch_rrlyrae_combined()

X = X[-5000:]
y = y[-5000:]

stars = (y == 0)
rrlyrae = (y == 1)

#------------------------------------------------------------
# plot the results
ax = plt.axes()

ax.plot(X[stars, 0], X[stars, 1], '.', ms=5, c='b', label='stars')
ax.plot(X[rrlyrae, 0], X[rrlyrae, 1], '.', ms=5, c='r', label='RR-Lyrae')

ax.legend(loc=3)

ax.set_xlabel('$u-g$')
ax.set_ylabel('$g-r$')

ax.set_xlim(0.7, 1.4)
ax.set_ylim(-0.2, 0.4)

plt.show()