SDSS Spectrum Example
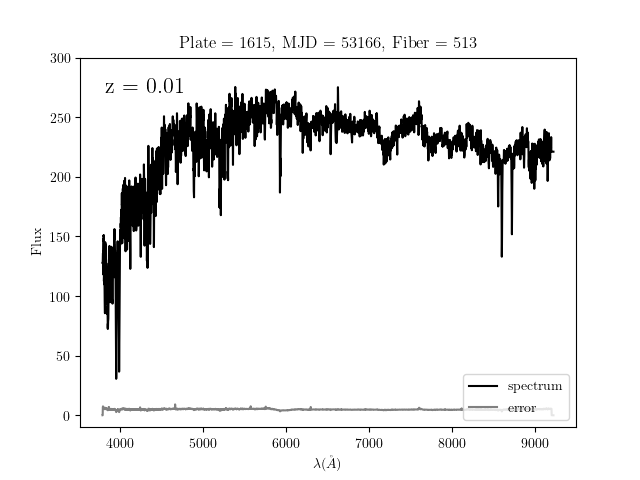
This example shows how to fetch and plot a spectrum from the SDSS database using the plate, MJD, and fiber numbers. The code below sends a query to the SDSS server for the given plate, fiber, and mjd, downloads the spectrum, and plots the result.
# Author: Jake VanderPlas <vanderplas@astro.washington.edu>
# License: BSD
#   The figure is an example from astroML: see http://astroML.github.com
from matplotlib import pyplot as plt
from astroML.datasets import fetch_sdss_spectrum

#------------------------------------------------------------
# Fetch single spectrum
plate = 1615
mjd = 53166
fiber = 513

spec = fetch_sdss_spectrum(plate, mjd, fiber)

#------------------------------------------------------------
# Plot the resulting spectrum
ax = plt.axes()
ax.plot(spec.wavelength(), spec.spectrum, '-k', label='spectrum')
ax.plot(spec.wavelength(), spec.error, '-', color='gray', label='error')

ax.legend(loc=4)

ax.set_title('Plate = %(plate)i, MJD = %(mjd)i, Fiber = %(fiber)i' % locals())

ax.text(0.05, 0.95, 'z = %.2f' % spec.z, size=16,
        ha='left', va='top', transform=ax.transAxes)

ax.set_xlabel(r'$\lambda (\AA)$')
ax.set_ylabel('Flux')

ax.set_ylim(-10, 300)

plt.show()