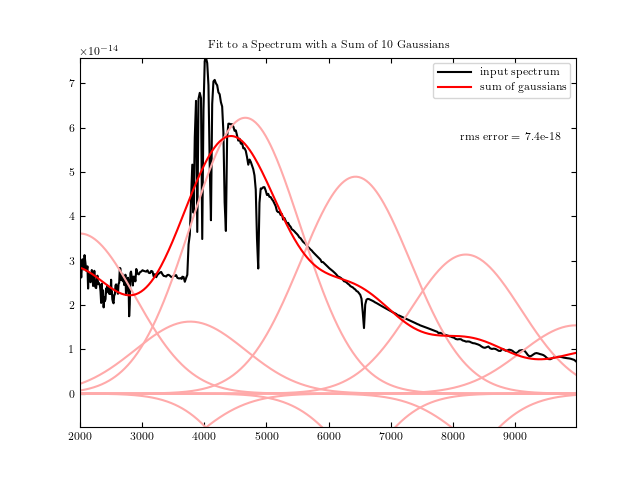
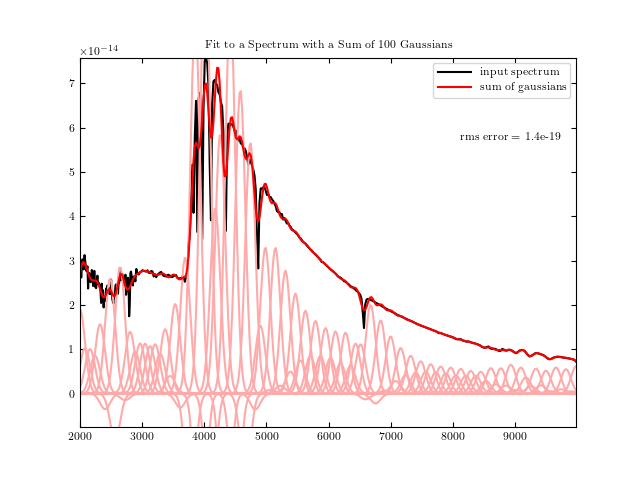
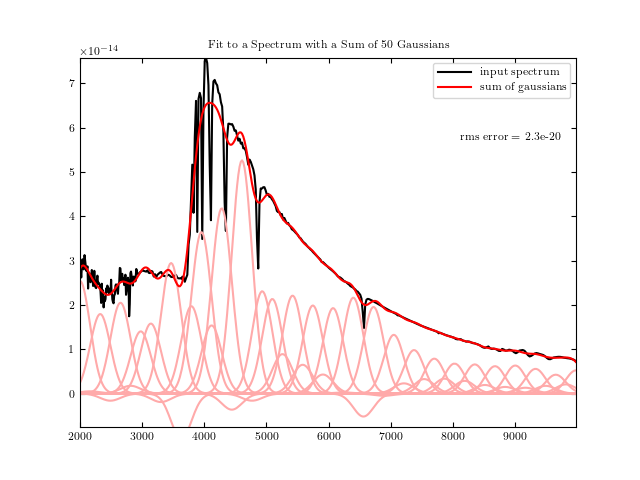
Linear Sum of Gaussians
Fitting a spectrum with a linear sum of gaussians.
# Author: Jake VanderPlas <vanderplas@astro.washington.edu>
# License: BSD
#   The figure is an example from astroML: see http://astroML.github.com
from matplotlib import pyplot as plt
from astroML.datasets import fetch_vega_spectrum
from astroML.sum_of_norms import sum_of_norms, norm

# Fetch the data
x, y = fetch_vega_spectrum()

# truncate the spectrum
mask = (x >= 2000) & (x < 10000)
x = x[mask]
y = y[mask]

for n_gaussians in (10, 50, 100):
    # compute the best-fit linear combination
    w_best, rms, locs, widths = sum_of_norms(x, y, n_gaussians,
                                             spacing='linear',
                                             full_output=True)

    norms = w_best * norm(x[:, None], locs, widths)

    # plot the results
    plt.figure()
    plt.plot(x, y, '-k', label='input spectrum')
    ylim = plt.ylim()

    plt.plot(x, norms, ls='-', c='#FFAAAA')
    plt.plot(x, norms.sum(1), '-r', label='sum of gaussians')
    plt.ylim(-0.1 * ylim[1], ylim[1])

    plt.legend(loc=0)

    plt.text(0.97, 0.8,
             "rms error = %.2g" % rms,
             ha='right', va='top', transform=plt.gca().transAxes)
    plt.title("Fit to a Spectrum with a Sum of %i Gaussians" % n_gaussians)

plt.show()