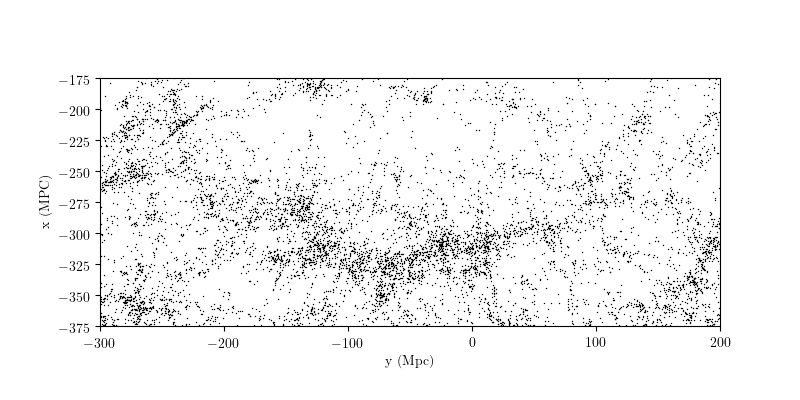
SDSS “Great Wall”
Plotting the SDSS “great wall”, a filament of galaxies visible by-eye in the projected locations of the SDSS spectroscopic galaxy sample. This follows a similar procedure to 1,
References
# Author: Jake VanderPlas <vanderplas@astro.washington.edu>
# License: BSD
#   The figure is an example from astroML: see http://astroML.github.com
import numpy as np
from matplotlib import pyplot as plt

from astroML.datasets import fetch_great_wall
from astroML.density_estimation import KNeighborsDensity

#------------------------------------------------------------
# Fetch the great wall data
X = fetch_great_wall()

#------------------------------------------------------------
# Plot the results
fig = plt.figure(figsize=(8, 4))

# First plot: scatter the points
ax = plt.subplot(111, aspect='equal')
ax.scatter(X[:, 1], X[:, 0], s=1, lw=0, c='k')

ax.set_xlim(-300, 200)
ax.set_ylim(-375, -175)

ax.set_xlabel('y (Mpc)')
ax.set_ylabel('x (MPC)')

plt.show()