import torch
import torch.nn as nn
import torch.nn.functional as F
import torch.utils.data as torchdata
from astroML.datasets import fetch_sdss_specgals
from astroML.utils.decorators import pickle_results
# This function adjusts matplotlib settings for a uniform feel in the textbook.
# Note that with usetex=True, fonts are rendered with LaTeX. This may
# result in an error if LaTeX is not installed on your system. In that case,
# you can set usetex to False.
import matplotlib.pyplot as plt
from astroML.plotting import setup_text_plots
setup_text_plots(fontsize=8, usetex=True)
# Fetch and prepare the data
data = fetch_sdss_specgals()
# put magnitudes into array
# normalize to zero mean and unit variance for easier training
datanormed = np.zeros((len(data), 6), dtype=np.float32)
for i, band in enumerate(['u', 'g', 'r', 'i', 'z']):
band = 'modelMag_' + band
datanormed[:, i] = (data[band] - data[band].mean()) / data[band].std()
# put redshifts into array
datanormed[:, 5] = data['z']
# define structure of neural net
class Net(nn.Module):
def __init__(self, nhidden):
super(Net, self).__init__()
self.fc_h = nn.Linear(5, nhidden)
self.fc_o = nn.Linear(nhidden, 1)
def forward(self, x):
h = F.relu(self.fc_h(x))
z = self.fc_o(h)
return z
# split data into 9:1 train:test
dataset = torchdata.TensorDataset(torch.tensor(datanormed[:, 0:5]),
torch.tensor(datanormed[:, 5]).view(-1, 1))
trainnum = datanormed.shape[0] // 10 * 9
traindata, testdata = torchdata.random_split(dataset, [trainnum, datanormed.shape[0] - trainnum])
traindataloader = torchdata.DataLoader(traindata, batch_size=128, shuffle=True)
@pickle_results('NNphotoz.pkl')
def train_NN():
model = Net(4)
criterion = torch.nn.MSELoss(reduction='sum')
optimizer = torch.optim.SGD(model.parameters(), lr=0.001)
scheduler = torch.optim.lr_scheduler.ReduceLROnPlateau(optimizer, verbose=True, patience=5, threshold=1e-3)
min_valid_loss = float('inf')
badepochs = 0
for t in range(1000):
train_loss = 0
for i, databatch in enumerate(traindataloader, 0):
photometry, redshifts = databatch
optimizer.zero_grad()
z_pred = model(photometry)
loss = criterion(z_pred, redshifts)
loss.backward()
optimizer.step()
train_loss += loss.item()
with torch.no_grad():
photometry = testdata[:][0]
redshifts = testdata[:][1]
z_pred = model(photometry)
valid_loss = criterion(z_pred, redshifts)
if t % 10 == 0:
print('Epoch %3i: train loss %0.3e validation loss %0.3e' % (t, \
train_loss / len(traindata), valid_loss / len(testdata)))
# stop training if validation loss has not fallen in 10 epochs
if valid_loss > min_valid_loss*(1-1e-3):
badepochs += 1
else:
min_valid_loss = valid_loss
badepochs = 0
if badepochs == 10:
print('Finished training')
break
scheduler.step(valid_loss)
return model
model = train_NN()
# plot the results
with torch.no_grad():
photometry = testdata[:][0]
redshifts = testdata[:][1]
z_pred = model(photometry)
fig = plt.figure(figsize=(5, 5))
fig.subplots_adjust(wspace=0.25,
left=0.1, right=0.95,
bottom=0.15, top=0.9)
ax = plt.axes()
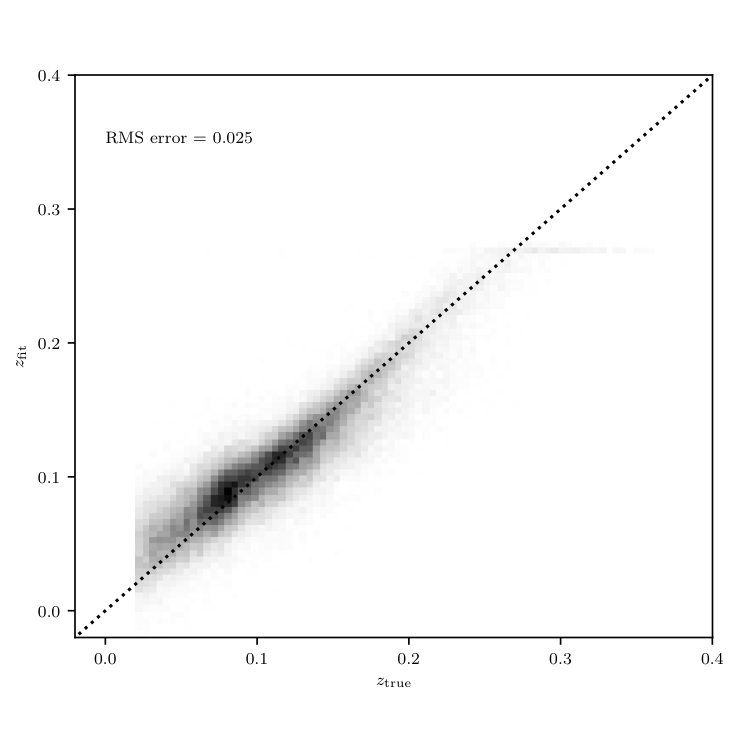
#ax.scatter(redshifts, z_pred, s=1, lw=0, c='k')
H, zs_bins, zp_bins = np.histogram2d(redshifts.numpy().flatten(), z_pred.numpy().flatten(), 151)
ax.imshow(H.T, origin='lower', interpolation='nearest', aspect='auto',
extent=[zs_bins[0], zs_bins[-1], zp_bins[0], zp_bins[-1]],
cmap=plt.cm.binary)
ax.plot([-0.1, 0.4], [-0.1, 0.4], ':k')
rms = np.sqrt(np.mean((z_pred-redshifts).numpy()**2))
ax.text(0, 0.35, 'RMS error = %0.3f' % np.sqrt(np.mean((z_pred-redshifts).numpy()**2)))
ax.set_xlim(-0.02, 0.4001)
ax.set_ylim(-0.02, 0.4001)
ax.xaxis.set_major_locator(plt.MultipleLocator(0.1))
ax.yaxis.set_major_locator(plt.MultipleLocator(0.1))
ax.set_xlabel(r'$z_{\rm true}$')
ax.set_ylabel(r'$z_{\rm fit}$')
plt.show()