Decision Tree for RR Lyrae Classification
Figure 9.12
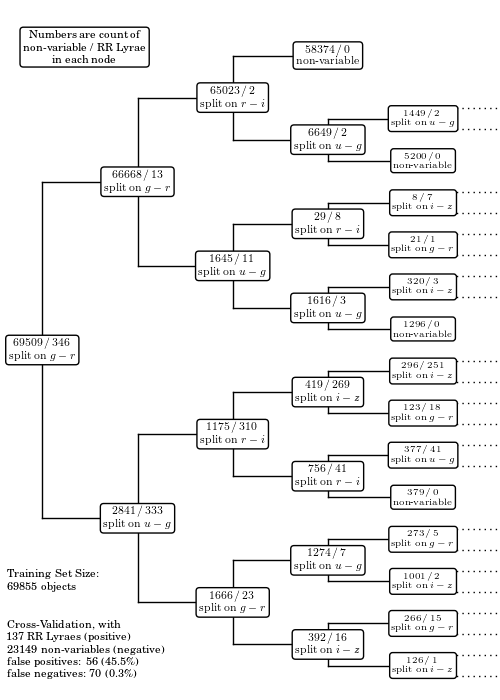
The decision tree for RR Lyrae classification. The numbers in each node are the statistics of the training sample of ~70,000 objects. The cross-validation statistics are shown in the bottom-left corner of the figure. See also figure 9.13.
WARNING: DeprecationWarning: Setting compute_importances is no longer required as version 0.14. Variable importances are now computed on the fly when accessing the feature_importances_ attribute. This parameter will be removed in 0.16. [sklearn.tree.tree]
----------------------------------------------------------------
partial training set: (69509 non-variable, 346 RR Lyrae)
positive = RR Lyrae, negative = non-variable
false positives: 56 (45.5%)
false negatives: 70 (0.3%)
WARNING: DeprecationWarning: Setting compute_importances is no longer required as version 0.14. Variable importances are now computed on the fly when accessing the feature_importances_ attribute. This parameter will be removed in 0.16. [sklearn.tree.tree]
----------------------------------------------------------------
full training set: (69509 non-variables, 346 RR Lyraes)
positive = RR Lyrae, negative = non-variables
false positives: 56 (45.5%)
false negatives: 70 (0.3%)
# Author: Jake VanderPlas
# License: BSD
#   The figure produced by this code is published in the textbook
#   "Statistics, Data Mining, and Machine Learning in Astronomy" (2013)
#   For more information, see http://astroML.github.com
#   To report a bug or issue, use the following forum:
#    https://groups.google.com/forum/#!forum/astroml-general
import numpy as np
from matplotlib import pyplot as plt

from sklearn.tree import DecisionTreeClassifier
from astroML.datasets import fetch_rrlyrae_combined
from astroML.utils import split_samples

#----------------------------------------------------------------------
# This function adjusts matplotlib settings for a uniform feel in the textbook.
# Note that with usetex=True, fonts are rendered with LaTeX.  This may
# result in an error if LaTeX is not installed on your system.  In that case,
# you can set usetex to False.
from astroML.plotting import setup_text_plots
setup_text_plots(fontsize=8, usetex=True)

# % sign needs to be escaped if usetex is True
import matplotlib
if matplotlib.rcParams.get('text.usetex'):
    pct = r'\%'
else:
    pct = '%'


def get_x_position(level, n_levels, xmin=0.01, xmax=1):
    dx = (xmax - xmin) / (n_levels - 1.)
    return xmin + level * dx


def get_y_position(level, j, ymin=0, ymax=1):
    n = 2 ** level
    dy = (ymax - ymin) * 1. / n
    return ymin + (j + 0.5) * dy


def draw_connections(x_positions, y_positions, children, i,
                     ax, linestyle='-k'):
    for (c, y) in zip(children, y_positions):
        if c == -1:
            continue
        ax.plot(x_positions[i - 1:i + 1], [y, y], linestyle, lw=1)

    for j in range(0, 2 ** i, 2):
        if children[j] == -1 or children[j + 1] == -1:
            continue
        ax.plot(2 * [x_positions[i - 1]], y_positions[j:j + 2],
                linestyle, lw=1)


def visualize_tree(T, data, classes, labels=None, levels=5,
                   ymin=0, ymax=1, xmin=0, xmax=1, ax=None):
    # to visualize the tree, we essentially need to re-build it: it doesn't
    # store the list of points at each node.
    if ax is None:
        ax = plt.gca()

    # get tree aspects
    try:
        # new versions of sklearn
        T_children = T.tree_.children
    except:
        # old versions of sklearn
        T_children = np.vstack([T.tree_.children_left,
                                T.tree_.children_right]).T
    try:
        # version < 0.14
        T_nsamples = T.tree_.n_samples
    except AttributeError:
        # version 0.14+
        T_nsamples = T.tree_.n_node_samples

    T_feature = T.tree_.feature
    T_threshold = T.tree_.threshold

    x_positions = get_x_position(np.arange(levels + 1), levels)
    node_list = np.array([0])
    new_data_masks = [np.ones(data.shape[0], dtype=bool)]

    for i in range(levels):
        y_positions = get_y_position(i, np.arange(2 ** i))

        mask = (node_list != -1)

        # plot the positions of the nodes
        ax.plot(x_positions[i] * np.ones(2 ** i)[mask],
                y_positions[mask], 'ok')

        data_masks = new_data_masks
        new_data_masks = []

        # list node info
        for j in range(2 ** i):
            if node_list[j] == -1:
                new_data_masks += [None, None]
                continue
            ind = node_list[j]

            # get masks of children
            split_mask = (data[:, T_feature[ind]] < T_threshold[ind])
            new_data_masks.append(np.logical_and(data_masks[j], split_mask))
            new_data_masks.append(np.logical_and(data_masks[j], ~split_mask))

            n_neg = np.sum(classes[data_masks[j]] == 0)
            n_pos = np.sum(classes[data_masks[j]] == 1)

            text = "$%i\,/\,%i$" % (n_neg, n_pos)

            # assure that we're doing this correctly
            assert (n_neg + n_pos == T_nsamples[ind])

            # check if node is a leaf
            if n_neg == 0:
                text += "\n" + r"${\rm(RR\,Lyrae)}$"
            elif n_pos == 0:
                text += "\n" + r"${\rm non}$-${\rm variable}$"
            else:
                text += "\n" + r"${\rm split\ on}$ %s" % labels[T_feature[ind]]

            if i < 4:
                fontsize = 8
            else:
                fontsize = 7

            ax.text(x_positions[i], y_positions[j], text,
                    ha='center', va='center',
                    fontsize=fontsize,
                    bbox=dict(boxstyle='round', ec='k', fc='w'))

        # draw lines connecting nodes to parents
        if i > 0:
            draw_connections(x_positions, y_positions, node_list, i, ax, '-k')

        # get next set of nodes
        node_list = np.concatenate(list(T_children[node_list]))

    # draw dotted line for last level
    y_positions = get_y_position(levels, np.arange(2 ** levels))
    draw_connections(x_positions, y_positions, node_list, levels, ax, ':k')

    # set suitable axes limits
    dx = 0.1 * (xmax - xmin)
    dy = 0.02 * (xmax - xmin)
    ax.set_xlim(xmin - dx, xmax + 2 * dx)
    ax.set_ylim(ymin - dy, ymax + dy)

#----------------------------------------------------------------------
# get data and split into training & testing sets
X, y = fetch_rrlyrae_combined()
(X_train, X_test), (y_train, y_test) = split_samples(X, y, [0.75, 0.25],
                                                     random_state=0)

N_tot = len(y)
N_st = np.sum(y == 0)
N_rr = N_tot - N_st
N_train = len(y_train)
N_test = len(y_test)
N_plot = 5000 + N_rr

clf = DecisionTreeClassifier(compute_importances=True,
                             random_state=0, criterion='entropy')
clf.fit(X_train, y_train)

y_out = clf.predict(X_test)

eq = (y_out == y_test)

#--------------------------------------------------
# compute statistics of cross-validation
tot_neg = np.sum(y_test == 0)
tot_pos = np.sum(y_test == 1)

fn = np.sum((y_test == 1) & (y_out == 0))
tn = np.sum((y_test == 0) & (y_out == 0))

fp = np.sum((y_test == 0) & (y_out == 1))
tp = np.sum((y_test == 1) & (y_out == 1))

print "----------------------------------------------------------------"
print ("partial training set: (%i non-variable, %i RR Lyrae)"
       % (np.sum(y_train == 0), np.sum(y_train == 1)))
print "positive = RR Lyrae, negative = non-variable"
print "false positives: %i (%.1f%%)" % (fp, fp * 100. / (fp + tp))
print "false negatives: %i (%.1f%%)" % (fn, fn * 100. / (fn + tn))

#------------------------------------------------------------
# Plot the results
fig = plt.figure(figsize=(5, 7), facecolor='w')
ax = fig.add_axes([0, 0, 1, 1], xticks=[], yticks=[], frameon=False)
visualize_tree(clf, X_train, y_train,
               labels=(['$u-g$', '$g-r$', '$r-i$', '$i-z$']))


ax.text(0.12, 0.95, ("Numbers are count of\n"
                     "non-variable / RR Lyrae\n"
                     "in each node"),
        ha='center', va='center',
        bbox=dict(boxstyle='round', ec='k', fc='w'))

ax.text(-0.08, 0.14, ("Training Set Size:\n"
                      "  %i objects" % len(y_train)),
        ha='left', va='bottom')

ax.text(-0.08, 0.01, ("Cross-Validation, with\n"
                      "  %i RR Lyraes (positive)\n"
                      "  %i non-variables (negative)\n"
                      "  false positives: %i (%.1f%s)\n"
                      "  false negatives: %i (%.1f%s)"
                      % (tot_pos, tot_neg,
                         fp, fp * 100. / (tp + fp), pct,
                         fn, fn * 100. / (tn + fn), pct)),
        ha='left', va='bottom')

#--------------------------------------------------
# compute statistics for a larger training set
clf = DecisionTreeClassifier(compute_importances=True,
                             random_state=0, criterion='entropy')
clf.fit(X_train, y_train)

y_out = clf.predict(X_test)

tot_neg = np.sum(y_test == 0)
tot_pos = np.sum(y_test == 1)

fn = np.sum((y_test == 1) & (y_out == 0))
tn = np.sum((y_test == 0) & (y_out == 0))

fp = np.sum((y_test == 0) & (y_out == 1))
tp = np.sum((y_test == 1) & (y_out == 1))

print "----------------------------------------------------------------"
print ("full training set: (%i non-variables, %i RR Lyraes)"
       % (np.sum(y_train == 0), np.sum(y_train == 1)))
print "positive = RR Lyrae, negative = non-variables"
print "false positives: %i (%.1f%%)" % (fp, fp * 100. / (fp + tp))
print "false negatives: %i (%.1f%%)" % (fn, fn * 100. / (fn + tn))

plt.show()