Fourier Reconstruction of RR-Lyrae Templates
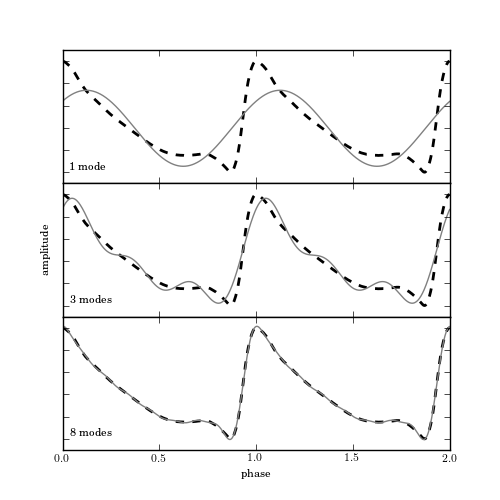
Figure 10.1
An example of a truncated Fourier representation of an RR Lyrae light curve. The thick dashed line shows the true curve; the gray lines show the approximation based on 1, 3, and 8 Fourier modes (sinusoids).
# Author: Jake VanderPlas
# License: BSD
#   The figure produced by this code is published in the textbook
#   "Statistics, Data Mining, and Machine Learning in Astronomy" (2013)
#   For more information, see http://astroML.github.com
#   To report a bug or issue, use the following forum:
#    https://groups.google.com/forum/#!forum/astroml-general
import numpy as np
from matplotlib import pyplot as plt

from astroML.datasets import fetch_rrlyrae_templates

#----------------------------------------------------------------------
# This function adjusts matplotlib settings for a uniform feel in the textbook.
# Note that with usetex=True, fonts are rendered with LaTeX.  This may
# result in an error if LaTeX is not installed on your system.  In that case,
# you can set usetex to False.
from astroML.plotting import setup_text_plots
setup_text_plots(fontsize=8, usetex=True)

#------------------------------------------------------------
# Load the RR Lyrae template
templates = fetch_rrlyrae_templates()
x, y = templates['115r'].T

#------------------------------------------------------------
# Plot the results
fig = plt.figure(figsize=(5, 5))
fig.subplots_adjust(hspace=0)

kvals = [1, 3, 8]
subplots = [311, 312, 313]

for (k, subplot) in zip(kvals, subplots):
    ax = fig.add_subplot(subplot)

    # Use FFT to fit a truncated Fourier series
    y_fft = np.fft.fft(y)
    y_fft[k + 1:-k] = 0
    y_fit = np.fft.ifft(y_fft).real

    # plot the true value and the k-term reconstruction
    ax.plot(np.concatenate([x, 1 + x]),
            np.concatenate([y, y]), '--k', lw=2)
    ax.plot(np.concatenate([x, 1 + x]),
            np.concatenate([y_fit, y_fit]), color='gray')

    label = "%i mode" % k
    if k > 1:
        label += 's'

    ax.text(0.02, 0.1, label, ha='left', va='bottom',
            transform=ax.transAxes)

    if subplot == subplots[-1]:
        ax.set_xlabel('phase')
    else:
        ax.xaxis.set_major_formatter(plt.NullFormatter())

    if subplot == subplots[1]:
        ax.set_ylabel('amplitude')
    ax.yaxis.set_major_formatter(plt.NullFormatter())

    ax.set_xlim(0, 2)
    ax.set_ylim(1.1, -0.1)

plt.show()