SDSS Moving Object Data
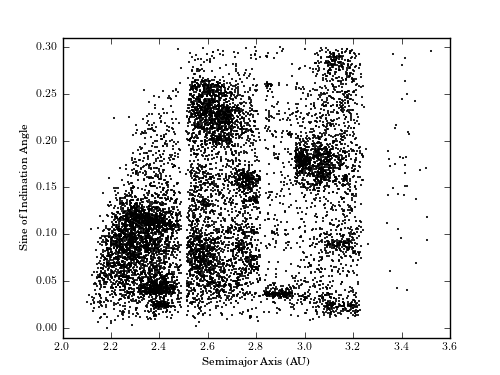
Figure 1.8.
The orbital semimajor axis vs. the orbital inclination angle diagram for the first 10,000 catalog entries from the SDSS Moving Object Catalog (after applying several quality cuts). The gaps at approximately 2.5, 2.8, and 3.3 AU are called the Kirkwood gaps and are due to orbital resonances with Jupiter. The several distinct clumps are called asteroid families and represent remnants from collisions of larger asteroids.
# Author: Jake VanderPlas
# License: BSD
#   The figure produced by this code is published in the textbook
#   "Statistics, Data Mining, and Machine Learning in Astronomy" (2013)
#   For more information, see http://astroML.github.com
#   To report a bug or issue, use the following forum:
#    https://groups.google.com/forum/#!forum/astroml-general
from matplotlib import pyplot as plt
from astroML.datasets import fetch_moving_objects

#----------------------------------------------------------------------
# This function adjusts matplotlib settings for a uniform feel in the textbook.
# Note that with usetex=True, fonts are rendered with LaTeX.  This may
# result in an error if LaTeX is not installed on your system.  In that case,
# you can set usetex to False.
from astroML.plotting import setup_text_plots
setup_text_plots(fontsize=8, usetex=True)

#------------------------------------------------------------
# Fetch the moving object data
data = fetch_moving_objects(Parker2008_cuts=True)

# Use only the first 10000 points
data = data[:10000]

a = data['aprime']
sini = data['sin_iprime']

#------------------------------------------------------------
# Plot the results
fig, ax = plt.subplots(figsize=(5, 3.75))
ax.plot(a, sini, '.', markersize=2, color='black')

ax.set_xlim(2.0, 3.6)
ax.set_ylim(-0.01, 0.31)

ax.set_xlabel('Semimajor Axis (AU)')
ax.set_ylabel('Sine of Inclination Angle')

plt.show()