Extreme Deconvolution example
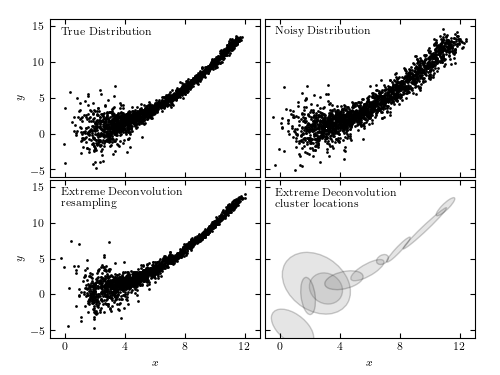
Figure 6.11
An example of extreme deconvolution showing a simulated two-dimensional distribution of points, where the positions are subject to errors. The top two panels show the distributions with small (left) and large (right) errors. The bottom panels show the densities derived from the noisy sample (top-right panel) using extreme deconvolution; the resulting distribution closely matches that shown in the top-left panel.
@pickle_results: computing results and saving to 'XD_toy.pkl'
# Author: Jake VanderPlas
# License: BSD
#   The figure produced by this code is published in the textbook
#   "Statistics, Data Mining, and Machine Learning in Astronomy" (2013)
#   For more information, see http://astroML.github.com
#   To report a bug or issue, use the following forum:
#    https://groups.google.com/forum/#!forum/astroml-general
import numpy as np
from matplotlib import pyplot as plt

from astroML.utils.decorators import pickle_results
from astroML.density_estimation import XDGMM
from astroML.plotting.tools import draw_ellipse

#----------------------------------------------------------------------
# This function adjusts matplotlib settings for a uniform feel in the textbook.
# Note that with usetex=True, fonts are rendered with LaTeX.  This may
# result in an error if LaTeX is not installed on your system.  In that case,
# you can set usetex to False.
if "setup_text_plots" not in globals():
    from astroML.plotting import setup_text_plots
setup_text_plots(fontsize=8, usetex=True)

#------------------------------------------------------------
# Sample the dataset
N = 2000
np.random.seed(0)

# generate the true data
x_true = (1.4 + 2 * np.random.random(N)) ** 2
y_true = 0.1 * x_true ** 2

# add scatter to "true" distribution
dx = 0.1 + 4. / x_true ** 2
dy = 0.1 + 10. / x_true ** 2

x_true += np.random.normal(0, dx, N)
y_true += np.random.normal(0, dy, N)

# add noise to get the "observed" distribution
dx = 0.2 + 0.5 * np.random.random(N)
dy = 0.2 + 0.5 * np.random.random(N)

x = x_true + np.random.normal(0, dx)
y = y_true + np.random.normal(0, dy)

# stack the results for computation
X = np.vstack([x, y]).T
Xerr = np.zeros(X.shape + X.shape[-1:])
diag = np.arange(X.shape[-1])
Xerr[:, diag, diag] = np.vstack([dx ** 2, dy ** 2]).T


#------------------------------------------------------------
# compute and save results
@pickle_results("XD_toy.pkl")
def compute_XD_results(n_components=10, max_iter=500):
    clf = XDGMM(n_components, max_iter=max_iter)
    clf.fit(X, Xerr)
    return clf


clf = compute_XD_results(10, 500)
sample = clf.sample(N)

#------------------------------------------------------------
# Plot the results
fig = plt.figure(figsize=(5, 3.75))
fig.subplots_adjust(left=0.1, right=0.95,
                    bottom=0.1, top=0.95,
                    wspace=0.02, hspace=0.02)

ax1 = fig.add_subplot(221)
ax1.scatter(x_true, y_true, s=4, lw=0, c='k')

ax2 = fig.add_subplot(222)
ax2.scatter(x, y, s=4, lw=0, c='k')

ax3 = fig.add_subplot(223)
ax3.scatter(sample[:, 0], sample[:, 1], s=4, lw=0, c='k')

ax4 = fig.add_subplot(224)
for i in range(clf.n_components):
    draw_ellipse(clf.mu[i], clf.V[i], scales=[2], ax=ax4,
                 ec='k', fc='gray', alpha=0.2)

titles = ["True Distribution", "Noisy Distribution",
          "Extreme Deconvolution\n  resampling",
          "Extreme Deconvolution\n  cluster locations"]

ax = [ax1, ax2, ax3, ax4]

for i in range(4):
    ax[i].set_xlim(-1, 13)
    ax[i].set_ylim(-6, 16)

    ax[i].xaxis.set_major_locator(plt.MultipleLocator(4))
    ax[i].yaxis.set_major_locator(plt.MultipleLocator(5))

    ax[i].text(0.05, 0.95, titles[i],
               ha='left', va='top', transform=ax[i].transAxes)

    if i in (0, 1):
        ax[i].xaxis.set_major_formatter(plt.NullFormatter())
    else:
        ax[i].set_xlabel('$x$')

    if i in (1, 3):
        ax[i].yaxis.set_major_formatter(plt.NullFormatter())
    else:
        ax[i].set_ylabel('$y$')

plt.show()