A 2x2 Contingency Table
Figure 3.3.
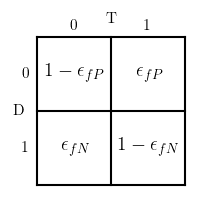
A contingency table showing p(T|D).
# Author: Jake VanderPlas
# License: BSD
#   The figure produced by this code is published in the textbook
#   "Statistics, Data Mining, and Machine Learning in Astronomy" (2013)
#   For more information, see http://astroML.github.com
#   To report a bug or issue, use the following forum:
#    https://groups.google.com/forum/#!forum/astroml-general
from matplotlib import pyplot as plt

#----------------------------------------------------------------------
# This function adjusts matplotlib settings for a uniform feel in the textbook.
# Note that with usetex=True, fonts are rendered with LaTeX.  This may
# result in an error if LaTeX is not installed on your system.  In that case,
# you can set usetex to False.
if "setup_text_plots" not in globals():
    from astroML.plotting import setup_text_plots
setup_text_plots(fontsize=8, usetex=True)

fig = plt.figure(figsize=(2, 2), facecolor='w')
ax = fig.add_axes((0, 0, 1, 1), xticks=[], yticks=[], frameon=False)

for i in [-1, 0, 1]:
    ax.plot([i, i], [-1, 1], '-k')
    ax.plot([-1, 1], [i, i], '-k')

kwds = dict(ha='center', va='center', size=11)

ax.text(-0.5, 1.15, '0', **kwds)
ax.text(0.5, 1.15, '1', **kwds)
ax.text(0, 1.25, 'T', **kwds)

ax.text(-1.15, 0.5, '0', **kwds)
ax.text(-1.15, -0.5, '1', **kwds)
ax.text(-1.25, 0, 'D', **kwds)

kwds['size'] = 14

ax.text(0.5, 0.5, '$\epsilon_{fP}$', **kwds)
ax.text(-0.5, 0.5, '$1 - \epsilon_{fP}$', **kwds)
ax.text(-0.5, -0.5, '$\epsilon_{fN}$', **kwds)
ax.text(0.5, -0.5, '$1 - \epsilon_{fN}$', **kwds)

ax.set_xlim(-1.5, 1.2)
ax.set_ylim(-1.2, 1.5)

plt.show()