Example of HealPix pixellization
Figure 1.15.
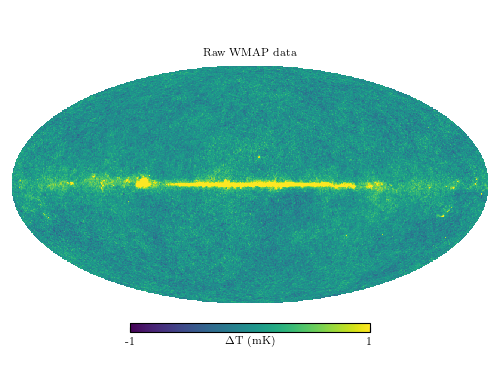
The top panel shows HEALPix pixels in nested order. The 12 fundamental sky divisions can be seen, as well as the hierarchical nature of the smaller pixels. This shows a pixelization with nside = 4, that is, each of the 12 large regions has 4 x 4 pixels, for a total of 192 pixels. The lower panel shows a seven-year co-add of raw WMAP data, plotted using the HEALPix projection using the HealPy package. This particular realization has nside = 512, for a total of 3,145,728 pixels. The pixels are roughly 6.8 arcminutes on a side.
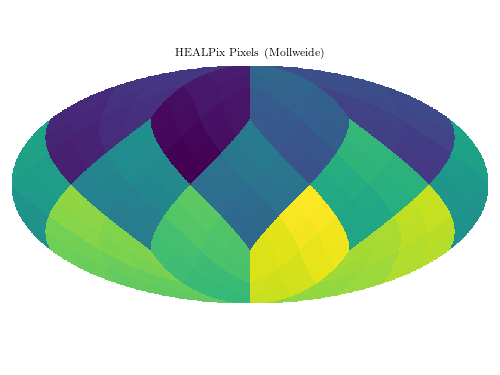
number of pixels: 192
NSIDE = 512
ORDERING = NESTED in fits file
INDXSCHM = IMPLICIT
Ordering converted to RING
# Author: Jake VanderPlas
# License: BSD
#   The figure produced by this code is published in the textbook
#   "Statistics, Data Mining, and Machine Learning in Astronomy" (2013)
#   For more information, see http://astroML.github.com
#   To report a bug or issue, use the following forum:
#    https://groups.google.com/forum/#!forum/astroml-general

from __future__ import print_function

import numpy as np
from matplotlib import pyplot as plt
# warning: due to a bug in healpy, importing it before pylab can cause
#  a segmentation fault in some circumstances.
import healpy as hp

from astroML.datasets import fetch_wmap_temperatures

#----------------------------------------------------------------------
# This function adjusts matplotlib settings for a uniform feel in the textbook.
# Note that with usetex=True, fonts are rendered with LaTeX.  This may
# result in an error if LaTeX is not installed on your system.  In that case,
# you can set usetex to False.
if "setup_text_plots" not in globals():
    from astroML.plotting import setup_text_plots
setup_text_plots(fontsize=8, usetex=True)

#------------------------------------------------------------
# First plot an example pixellization

# Prepare the healpix pixels
NSIDE = 4
m = np.arange(hp.nside2npix(NSIDE))
print("number of pixels:", len(m))

# Plot the pixelization
fig = plt.figure(1, figsize=(5, 3.75))
hp.mollview(m, nest=True, title="HEALPix Pixels (Mollweide)", fig=1)

# remove colorbar: we don't need it for this plot
fig.delaxes(fig.axes[1])

#------------------------------------------------------------
# Next plot the wmap pixellization
wmap_unmasked = fetch_wmap_temperatures(masked=False)

# plot the unmasked map
fig = plt.figure(2, figsize=(5, 3.75))
hp.mollview(wmap_unmasked, min=-1, max=1, title='Raw WMAP data',
            unit=r'$\Delta$T (mK)', fig=2)
fig.axes[1].texts[0].set_fontsize(8)

plt.show()