SDSS Imaging
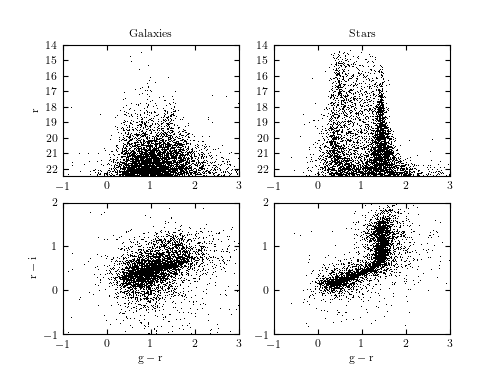
Figure 1.1
The r vs. g-r color-magnitude diagrams and the r-i vs. g-r color-color diagrams for galaxies (left column) and stars (right column) from the SDSS imaging catalog. Only the first 5000 entries for each subset are shown in order to minimize the blending of points (various more sophisticated visualization methods are discussed in Section 1.6).
# Author: Jake VanderPlas
# License: BSD
#   The figure produced by this code is published in the textbook
#   "Statistics, Data Mining, and Machine Learning in Astronomy" (2013)
#   For more information, see http://astroML.github.com
#   To report a bug or issue, use the following forum:
#    https://groups.google.com/forum/#!forum/astroml-general
import numpy as np
from matplotlib import pyplot as plt
from astroML.datasets import fetch_imaging_sample

#----------------------------------------------------------------------
# This function adjusts matplotlib settings for a uniform feel in the textbook.
# Note that with usetex=True, fonts are rendered with LaTeX.  This may
# result in an error if LaTeX is not installed on your system.  In that case,
# you can set usetex to False.
if "setup_text_plots" not in globals():
    from astroML.plotting import setup_text_plots
setup_text_plots(fontsize=8, usetex=True)


def get_stars_and_galaxies(Nstars=5000, Ngals=5000):
    """Get the subset of star/galaxy data to plot"""
    data = fetch_imaging_sample()

    objtype = data['type']

    stars = data[objtype == 6][:Nstars]
    galaxies = data[objtype == 3][:Ngals]

    return stars, galaxies


def plot_stars_and_galaxies(stars, galaxies):
    """Plot the star and galaxy data"""
    # Note: we use plot() rather than scatter() because it's more efficient
    # for large numbers of points.
    # Scatter should be used only when points need to be different colors
    # and/or sizes
    plot_kwargs = dict(color='k', linestyle='none', marker=',')

    fig = plt.figure(figsize=(5, 3.75))

    ax1 = fig.add_subplot(221)
    ax1.plot(galaxies['gRaw'] - galaxies['rRaw'],
             galaxies['rRaw'],
             **plot_kwargs)

    ax2 = fig.add_subplot(223, sharex=ax1)
    ax2.plot(galaxies['gRaw'] - galaxies['rRaw'],
             galaxies['rRaw'] - galaxies['iRaw'],
             **plot_kwargs)

    ax3 = fig.add_subplot(222, sharey=ax1)
    ax3.plot(stars['gRaw'] - stars['rRaw'],
             stars['rRaw'],
             **plot_kwargs)

    ax4 = fig.add_subplot(224, sharex=ax3, sharey=ax2)
    ax4.plot(stars['gRaw'] - stars['rRaw'],
             stars['rRaw'] - stars['iRaw'],
             **plot_kwargs)

    # set labels and titles
    ax1.set_ylabel(r'${\rm r}$')
    ax2.set_ylabel(r'${\rm r - i}$')
    ax2.set_xlabel(r'${\rm g - r}$')
    ax4.set_xlabel(r'${\rm g - r}$')
    ax1.set_title('Galaxies')
    ax3.set_title('Stars')

    # set axis limits
    ax2.set_xlim(-1, 3)
    ax3.set_ylim(22.5, 14)
    ax4.set_xlim(-1, 3)
    ax4.set_ylim(-1, 2)

    # adjust tick spacings on all axes
    for ax in (ax1, ax2, ax3, ax4):
        ax.xaxis.set_major_locator(plt.MultipleLocator(1))
        ax.yaxis.set_major_locator(plt.MultipleLocator(1))

#------------------------------------------------------------
# Generate and show the plot
stars, galaxies = get_stars_and_galaxies()
plot_stars_and_galaxies(stars, galaxies)
plt.show()