SDSS Filters
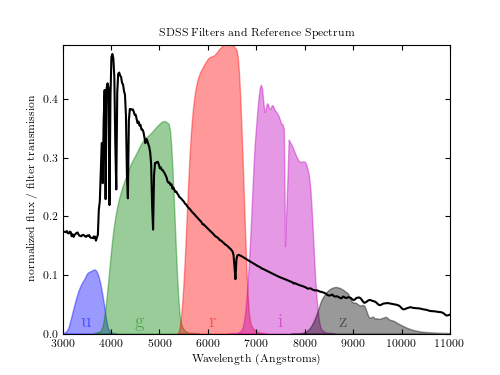
Figure C.1
The five SDSS filters, showing the total transmission taking into account
atmospheric transmission and instrumental effects such as CCD efficiency.
Shown for reference is the spectrum ( ) of a star
similar to Vega (alpha-Lyr), which for many years was used as a reference
flux for magnitude calibration.
) of a star
similar to Vega (alpha-Lyr), which for many years was used as a reference
flux for magnitude calibration.
# Author: Jake VanderPlas
# License: BSD
#   The figure produced by this code is published in the textbook
#   "Statistics, Data Mining, and Machine Learning in Astronomy" (2013)
#   For more information, see http://astroML.github.com
#   To report a bug or issue, use the following forum:
#    https://groups.google.com/forum/#!forum/astroml-general
from matplotlib import pyplot as plt
from astroML.datasets import fetch_sdss_filter, fetch_vega_spectrum

#----------------------------------------------------------------------
# This function adjusts matplotlib settings for a uniform feel in the textbook.
# Note that with usetex=True, fonts are rendered with LaTeX.  This may
# result in an error if LaTeX is not installed on your system.  In that case,
# you can set usetex to False.
if "setup_text_plots" not in globals():
    from astroML.plotting import setup_text_plots
setup_text_plots(fontsize=8, usetex=True)

#------------------------------------------------------------
# Set up figure and axes
fig = plt.figure(figsize=(5, 3.75))
ax = fig.add_subplot(111)

#----------------------------------------------------------------------
# Fetch and plot the Vega spectrum
spec = fetch_vega_spectrum()
lam = spec[0]
spectrum = spec[1] / 2.1 / spec[1].max()
ax.plot(lam, spectrum, '-k')

#------------------------------------------------------------
# Fetch and plot the five filters
text_kwargs = dict(ha='center', va='center', alpha=0.5, fontsize=14)

for f, c, loc in zip('ugriz', 'bgrmk', [3500, 4600, 6100, 7500, 8800]):
    data = fetch_sdss_filter(f)
    ax.fill(data[0], data[1], ec=c, fc=c, alpha=0.4)
    ax.text(loc, 0.02, f, color=c, **text_kwargs)

ax.set_xlim(3000, 11000)

ax.set_title('SDSS Filters and Reference Spectrum')
ax.set_xlabel('Wavelength (Angstroms)')
ax.set_ylabel('normalized flux / filter transmission')

plt.show()