Coin Toss Odds Ratio
Figure 5.1
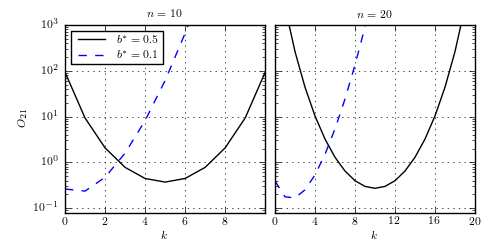
Odds ratio for two models,  , describing coin tosses (eq. 5.26).
Out of N tosses (left: N = 10; right: N = 20), k tosses are heads. Model 2 is
a one-parameter model with the heads probability determined from data
(
, describing coin tosses (eq. 5.26).
Out of N tosses (left: N = 10; right: N = 20), k tosses are heads. Model 2 is
a one-parameter model with the heads probability determined from data
( ), and model 1 claims an a priori known heads probability
equal to
), and model 1 claims an a priori known heads probability
equal to  .The results are shown for two values of ,
as indicated in the legend. Note that the odds ratio is minimized and below 1
(model 1 wins) when
.The results are shown for two values of ,
as indicated in the legend. Note that the odds ratio is minimized and below 1
(model 1 wins) when  .
.
# Author: Jake VanderPlas
# License: BSD
#   The figure produced by this code is published in the textbook
#   "Statistics, Data Mining, and Machine Learning in Astronomy" (2013)
#   For more information, see http://astroML.github.com
#   To report a bug or issue, use the following forum:
#    https://groups.google.com/forum/#!forum/astroml-general
import numpy as np
from scipy import integrate
from matplotlib import pyplot as plt

#----------------------------------------------------------------------
# This function adjusts matplotlib settings for a uniform feel in the textbook.
# Note that with usetex=True, fonts are rendered with LaTeX.  This may
# result in an error if LaTeX is not installed on your system.  In that case,
# you can set usetex to False.
from astroML.plotting import setup_text_plots
setup_text_plots(fontsize=8, usetex=True)


@np.vectorize
def odds_ratio(n, k, bstar):
    """Odds ratio between M_2, where the heads probability is unknown,
    and M_1, where the heads probability is known to be `bstar`, evaluated
    in the case of `k` heads observed in `n` tosses.

    Eqn. 5.25 in the text
    """
    factor = 1. / (bstar ** k * (1 - bstar) ** (n - k))
    f = lambda b: b ** k * (1 - b) ** (n - k)

    return factor * integrate.quad(f, 0, 1)[0]

#------------------------------------------------------------
# Plot the results
fig = plt.figure(figsize=(5, 2.5))
fig.subplots_adjust(left=0.13, right=0.95, wspace=0.05, bottom=0.15)

subplots = [121, 122]
n_array = [10, 20]

linestyles = ['-k', '--b']
bstar_array = [0.5, 0.1]

for subplot, n in zip(subplots, n_array):
    ax = fig.add_subplot(subplot, yscale='log')
    k = np.arange(n + 1)

    # plot curves for two values of bstar
    for ls, bstar in zip(linestyles, bstar_array):
        ax.plot(k, odds_ratio(n, k, bstar), ls,
                label=r'$b^* = %.1f$' % bstar)

    if subplot == 121:
        ax.set_xlim(0, n - 0.01)
        ax.set_ylabel(r'$O_{21}$')
        ax.legend(loc=2)
    else:
        ax.set_xlim(0, n)
        ax.yaxis.set_major_formatter(plt.NullFormatter())

    ax.set_xlabel('$k$')
    ax.set_title('$n = %i$' % n)
    ax.set_ylim(8E-2, 1E3)
    ax.xaxis.set_major_locator(plt.MultipleLocator(n / 5))
    ax.grid()


plt.show()