Odds Ratio for Cauchy vs Gaussian
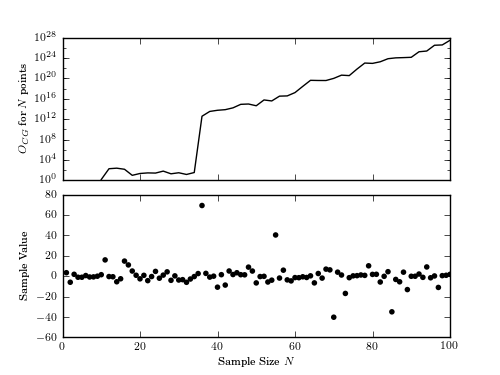
Figure 5.19
The Cauchy vs. Gaussian model odds ratio for a data set drawn from a Cauchy distribution (mu = 0, gamma = 2) as a function of the number of points used to perform the calculation. Note the sharp increase in the odds ratio when points falling far from the mean are added.
Results for first 10 points:
  L(M = Cauchy) = 1.18e-12 +/- 1.92e-16
  L(M = Gauss)  = 8.09e-13 +/- 1.32e-16
  O_{CG} = 1.45 +/- 0.000237
# Author: Jake VanderPlas
# License: BSD
#   The figure produced by this code is published in the textbook
#   "Statistics, Data Mining, and Machine Learning in Astronomy" (2013)
#   For more information, see http://astroML.github.com
#   To report a bug or issue, use the following forum:
#    https://groups.google.com/forum/#!forum/astroml-general
import numpy as np
from matplotlib import pyplot as plt
from scipy.stats import cauchy, norm
from scipy import integrate

#----------------------------------------------------------------------
# This function adjusts matplotlib settings for a uniform feel in the textbook.
# Note that with usetex=True, fonts are rendered with LaTeX.  This may
# result in an error if LaTeX is not installed on your system.  In that case,
# you can set usetex to False.
from astroML.plotting import setup_text_plots
setup_text_plots(fontsize=8, usetex=True)


def logL_cauchy(xi, gamma, mu,
                mu_min=-10, mu_max=10, sigma_min=0.01, sigma_max=100):
    """Equation 5.74: cauchy likelihood"""
    xi = np.asarray(xi)
    n = xi.size
    shape = np.broadcast(gamma, mu).shape

    xi = xi.reshape(xi.shape + tuple([1 for s in shape]))

    prior_normalization = - (np.log(mu_max - mu_min)
                             + np.log(np.log(sigma_max / sigma_min)))

    return (prior_normalization
            - n * np.log(np.pi)
            + (n - 1) * np.log(gamma)
            - np.sum(np.log(gamma ** 2 + (xi - mu) ** 2), 0))


def logL_gaussian(xi, sigma, mu,
                  mu_min=-10, mu_max=10, sigma_min=0.01, sigma_max=100):
    """Equation 5.57: gaussian likelihood"""
    xi = np.asarray(xi)
    n = xi.size
    shape = np.broadcast(sigma, mu).shape

    xi = xi.reshape(xi.shape + tuple([1 for s in shape]))

    prior_normalization = - (np.log(mu_max - mu_min)
                             + np.log(np.log(sigma_max / sigma_min)))

    return (prior_normalization
            - 0.5 * n * np.log(2 * np.pi)
            - (n + 1) * np.log(sigma)
            - np.sum(0.5 * ((xi - mu) / sigma) ** 2, 0))


def calculate_odds_ratio(xi, epsrel=1E-8, epsabs=1E-15):
    """
    Compute the odds ratio by perfoming a double integral
    over the likelihood space.
    """
    gauss_Ifunc = lambda mu, sigma: np.exp(logL_gaussian(xi, mu, sigma))
    cauchy_Ifunc = lambda mu, gamma: np.exp(logL_cauchy(xi, mu, gamma))

    I_gauss, err_gauss = integrate.dblquad(gauss_Ifunc, -np.inf, np.inf,
                                           lambda x: 0, lambda x: np.inf,
                                           epsabs=epsabs, epsrel=epsrel)
    I_cauchy, err_cauchy = integrate.dblquad(cauchy_Ifunc, -np.inf, np.inf,
                                             lambda x: 0, lambda x: np.inf,
                                             epsabs=epsabs, epsrel=epsrel)

    if I_gauss == 0:
        O_CG = np.inf
        err_O_CG = np.inf
    else:
        O_CG = I_cauchy / I_gauss
        err_O_CG = O_CG * np.sqrt((err_gauss / I_gauss) ** 2)

    return (I_gauss, err_gauss), (I_cauchy, err_cauchy), (O_CG, err_O_CG)


#------------------------------------------------------------
# Draw points from a Cauchy distribution
np.random.seed(44)
mu = 0
gamma = 2
xi = cauchy(mu, gamma).rvs(100)

#------------------------------------------------------------
# compute the odds ratio for the first 10 points
((I_gauss, err_gauss),
 (I_cauchy, err_cauchy),
 (O_CG, err_O_CG)) = calculate_odds_ratio(xi[:10])

print "Results for first 10 points:"
print "  L(M = Cauchy) = %.2e +/- %.2e" % (I_cauchy, err_cauchy)
print "  L(M = Gauss)  = %.2e +/- %.2e" % (I_gauss, err_gauss)
print "  O_{CG} = %.3g +/- %.3g" % (O_CG, err_O_CG)

#------------------------------------------------------------
# calculate the results as a function of number of points
Nrange = np.arange(10, 101, 2)
Odds = np.zeros(Nrange.shape)
for i, N in enumerate(Nrange):
    res = calculate_odds_ratio(xi[:N])
    Odds[i] = res[2][0]

#------------------------------------------------------------
# plot the results
fig = plt.figure(figsize=(5, 3.75))
fig.subplots_adjust(hspace=0.1)

ax1 = fig.add_subplot(211, yscale='log')
ax1.plot(Nrange, Odds, '-k')
ax1.set_ylabel(r'$O_{CG}$ for $N$ points')
ax1.set_xlim(0, 100)
ax1.xaxis.set_major_formatter(plt.NullFormatter())
ax1.yaxis.set_major_locator(plt.LogLocator(base=10000.0))

ax2 = fig.add_subplot(212)
ax2.scatter(np.arange(1, len(xi) + 1), xi, lw=0, s=16, c='k')
ax2.set_xlim(0, 100)
ax2.set_xlabel('Sample Size $N$')
ax2.set_ylabel('Sample Value')

plt.show()