Photometric Redshifts by Decision Trees
Figure 9.14
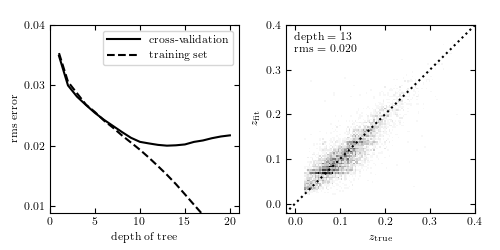
Photometric redshift estimation using decision-tree regression. The data is described in Section 1.5.5. The training set consists of u, g , r, i, z magnitudes of 60,000 galaxies from the SDSS spectroscopic sample. Cross-validation is performed on an additional 6000 galaxies. The left panel shows training error and cross-validation error as a function of the maximum depth of the tree. For a number of nodes N > 13, overfitting is evident.
# Author: Jake VanderPlas
# License: BSD
#   The figure produced by this code is published in the textbook
#   "Statistics, Data Mining, and Machine Learning in Astronomy" (2013)
#   For more information, see http://astroML.github.com
#   To report a bug or issue, use the following forum:
#    https://groups.google.com/forum/#!forum/astroml-general
import numpy as np
from matplotlib import pyplot as plt

from sklearn.tree import DecisionTreeRegressor
from astroML.datasets import fetch_sdss_specgals

#----------------------------------------------------------------------
# This function adjusts matplotlib settings for a uniform feel in the textbook.
# Note that with usetex=True, fonts are rendered with LaTeX.  This may
# result in an error if LaTeX is not installed on your system.  In that case,
# you can set usetex to False.
if "setup_text_plots" not in globals():
    from astroML.plotting import setup_text_plots
setup_text_plots(fontsize=8, usetex=True)

#------------------------------------------------------------
# Fetch data and prepare it for the computation
data = fetch_sdss_specgals()

# put magnitudes in a matrix
mag = np.vstack([data['modelMag_%s' % f] for f in 'ugriz']).T
z = data['z']

# train on ~60,000 points
mag_train = mag[::10]
z_train = z[::10]

# test on ~6,000 separate points
mag_test = mag[1::100]
z_test = z[1::100]

#------------------------------------------------------------
# Compute the cross-validation scores for several tree depths
depth = np.arange(1, 21)
rms_test = np.zeros(len(depth))
rms_train = np.zeros(len(depth))
i_best = 0
z_fit_best = None

for i, d in enumerate(depth):
    clf = DecisionTreeRegressor(max_depth=d, random_state=0)
    clf.fit(mag_train, z_train)

    z_fit_train = clf.predict(mag_train)
    z_fit = clf.predict(mag_test)
    rms_train[i] = np.mean(np.sqrt((z_fit_train - z_train) ** 2))
    rms_test[i] = np.mean(np.sqrt((z_fit - z_test) ** 2))

    if rms_test[i] <= rms_test[i_best]:
        i_best = i
        z_fit_best = z_fit

best_depth = depth[i_best]

#------------------------------------------------------------
# Plot the results
fig = plt.figure(figsize=(5, 2.5))
fig.subplots_adjust(wspace=0.25,
                    left=0.1, right=0.95,
                    bottom=0.15, top=0.9)

# first panel: cross-validation
ax = fig.add_subplot(121)
ax.plot(depth, rms_test, '-k', label='cross-validation')
ax.plot(depth, rms_train, '--k', label='training set')
ax.set_xlabel('depth of tree')
ax.set_ylabel('rms error')
ax.yaxis.set_major_locator(plt.MultipleLocator(0.01))
ax.set_xlim(0, 21)
ax.set_ylim(0.009,  0.04)
ax.legend(loc=1)

# second panel: best-fit results
ax = fig.add_subplot(122)
edges = np.linspace(z_test.min(), z_test.max(), 101)
H, zs_bins, zp_bins = np.histogram2d(z_test, z_fit_best, bins=edges)
ax.imshow(H.T, origin='lower', interpolation='nearest', aspect='auto',
           extent=[zs_bins[0], zs_bins[-1], zs_bins[0], zs_bins[-1]],
           cmap=plt.cm.binary)
ax.plot([-0.1, 0.4], [-0.1, 0.4], ':k')
ax.text(0.04, 0.96, "depth = %i\nrms = %.3f" % (best_depth, rms_test[i_best]),
        ha='left', va='top', transform=ax.transAxes)
ax.set_xlabel(r'$z_{\rm true}$')
ax.set_ylabel(r'$z_{\rm fit}$')

ax.set_xlim(-0.02, 0.4001)
ax.set_ylim(-0.02, 0.4001)
ax.xaxis.set_major_locator(plt.MultipleLocator(0.1))
ax.yaxis.set_major_locator(plt.MultipleLocator(0.1))

plt.show()