Diagramatic Description of n-point Correlations
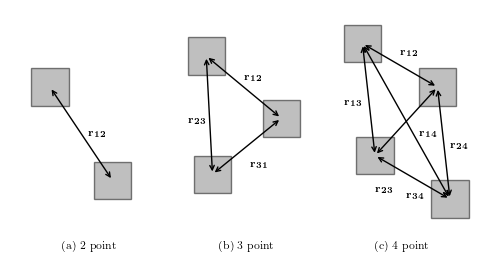
Figure 6.16
An example of n-tuple configurations for the two-point, three-point, and four-point correlation functions (reproduced from WSAS).
# Author: Jake VanderPlas
# License: BSD
#   The figure produced by this code is published in the textbook
#   "Statistics, Data Mining, and Machine Learning in Astronomy" (2013)
#   For more information, see http://astroML.github.com
#   To report a bug or issue, use the following forum:
#    https://groups.google.com/forum/#!forum/astroml-general
import itertools
import numpy as np
from matplotlib import pyplot as plt
from matplotlib.patches import Rectangle

#----------------------------------------------------------------------
# This function adjusts matplotlib settings for a uniform feel in the textbook.
# Note that with usetex=True, fonts are rendered with LaTeX.  This may
# result in an error if LaTeX is not installed on your system.  In that case,
# you can set usetex to False.
if "setup_text_plots" not in globals():
    from astroML.plotting import setup_text_plots
setup_text_plots(fontsize=8, usetex=True)

#------------------------------------------------------------
# Set up plot
fig = plt.figure(figsize=(5, 2.8), facecolor='w')

rect_locs = [(0.5, 3.3), (1.5, 1.8),
             (3.0, 3.8), (4.2, 2.8), (3.1, 1.9),
             (5.5, 4.0), (6.7, 3.3), (5.7, 2.2), (6.9, 1.5)]
x_size = 0.6
y_size = 0.6

ax = fig.add_axes([0, 0, 1, 1], frameon=False, xticks=[], yticks=[])
for loc in rect_locs:
    ax.add_patch(Rectangle(loc, x_size, y_size,
                           fc='gray', ec='k', alpha=0.5))

for indices in [(0, 1),
                (2, 3, 4),
                (5, 6, 7, 8)]:
    for pair in itertools.combinations(indices, 2):
        ax.annotate("", np.array(rect_locs[pair[0]]) + 0.5 * x_size,
                    np.array(rect_locs[pair[1]]) + 0.5 * y_size,
                    arrowprops=dict(arrowstyle='<->'))

ax.text(1.0, 1.0, "(a) 2 point")
ax.text(3.5, 1.0, "(b) 3 point")
ax.text(6.0, 1.0, "(c) 4 point")

ax.text(1.4, 2.8, '$\mathbf{r_{12}}$')

ax.text(3.9, 3.7, '$\mathbf{r_{12}}$')
ax.text(3.0, 3.0, '$\mathbf{r_{23}}$')
ax.text(4.0, 2.3, '$\mathbf{r_{31}}$')

ax.text(6.4, 4.1, '$\mathbf{r_{12}}$')
ax.text(5.5, 3.3, '$\mathbf{r_{13}}$')
ax.text(7.2, 2.6, '$\mathbf{r_{24}}$')
ax.text(6.7, 2.8, '$\mathbf{r_{14}}$')
ax.text(6.0, 1.9, '$\mathbf{r_{23}}$')
ax.text(6.5, 1.8, '$\mathbf{r_{34}}$')

ax.set_xlim(0, 8)
ax.set_ylim(0.5, 5)
plt.show()