Random Values from an Empirical Distribution
Figure 3.25.
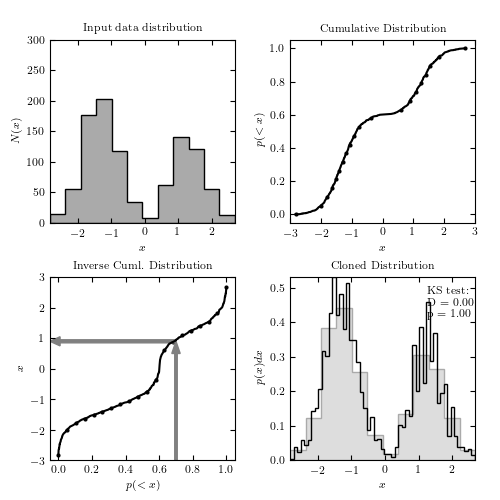
A demonstration of how to empirically clone a distribution, using a spline interpolation to approximate the inverse of the observed cumulative distribution. This allows us to nonparametrically select new random samples approximating an observed distribution. First the list of points is sorted, and the rank of each point is used to approximate the cumulative distribution (upper right). Flipping the axes gives the inverse cumulative distribution on a regular grid (lower left). After performing a cubic spline fit to the inverse distribution, a uniformly sampled x value maps to a y value which approximates the observed pdf. The lower-right panel shows the result. The K-S test (see section 4.7.2) indicates that the samples are consistent with being drawn from the same distribution. This method, while fast and effective, cannot be easily extended to multiple dimensions.
This example uses the routine
astroML.density_estimation.EmpiricalDistribution
to clone the distribution
KS test: D = 0.0028; p = 1
# Author: Jake VanderPlas
# License: BSD
#   The figure produced by this code is published in the textbook
#   "Statistics, Data Mining, and Machine Learning in Astronomy" (2013)
#   For more information, see http://astroML.github.com
#   To report a bug or issue, use the following forum:
#    https://groups.google.com/forum/#!forum/astroml-general
from __future__ import print_function

import numpy as np
from matplotlib import pyplot as plt
from scipy import stats, interpolate
from astropy.visualization import hist
from astroML.density_estimation import EmpiricalDistribution

#----------------------------------------------------------------------
# This function adjusts matplotlib settings for a uniform feel in the textbook.
# Note that with usetex=True, fonts are rendered with LaTeX.  This may
# result in an error if LaTeX is not installed on your system.  In that case,
# you can set usetex to False.
if "setup_text_plots" not in globals():
    from astroML.plotting import setup_text_plots
setup_text_plots(fontsize=8, usetex=True)

#------------------------------------------------------------
# Create a distribution and clone it
Ndata = 1000
Nclone = 100000
np.random.seed(0)

# generate an 'observed' bimodal distribution with 10000 values
dists = (stats.norm(-1.3, 0.5), stats.norm(1.3, 0.5))
fracs = (0.6, 0.4)
x = np.hstack((d.rvs(int(f * Ndata)) for d, f in zip(dists, fracs)))

# We can clone the distribution easily with this function
x_cloned = EmpiricalDistribution(x).rvs(Nclone)

# compute the KS test to check if they're the same
D, p = stats.ks_2samp(x, x_cloned)
print("KS test: D = %.2g; p = %.2g" % (D, p))

#------------------------------------------------------------
# For the sake of this example, we need to calculate some
#  of the partial steps used by EmpiricalDistribution

# create a cumulative distribution
x.sort()
Px_cuml = np.linspace(0, 1, Ndata)

# set up an interpolation of the inverse cumulative distribution
tck = interpolate.splrep(Px_cuml, x)

# sample evenly along the cumulative distribution, and interpolate
Px_cuml_sample = np.linspace(0, 1, 10 * Ndata)
x_sample = interpolate.splev(Px_cuml_sample, tck)

#------------------------------------------------------------
# Plot the cloned distribution and the procedure for obtaining it
fig = plt.figure(figsize=(5, 5))
fig.subplots_adjust(hspace=0.3, left=0.1, right=0.95,
                    bottom=0.08, top=0.92, wspace=0.3)

indices = np.linspace(0, Ndata - 1, 20).astype(int)

# plot a histogram of the input
ax = fig.add_subplot(221)
hist(x, bins='knuth', ax=ax,
     histtype='stepfilled', ec='k', fc='#AAAAAA')
ax.set_ylim(0, 300)
ax.set_title('Input data distribution')
ax.set_xlabel('$x$')
ax.set_ylabel('$N(x)$')

# plot the cumulative distribution
ax = fig.add_subplot(222)
ax.scatter(x[indices], Px_cuml[indices], lw=0, c='k', s=9)
ax.plot(x, Px_cuml, '-k')
ax.set_xlim(-3, 3)
ax.set_ylim(-0.05, 1.05)
ax.set_title('Cumulative Distribution')
ax.set_xlabel('$x$')
ax.set_ylabel('$p(<x)$')

# plot the inverse cumulative distribution and spline fit
ax = fig.add_subplot(223)
ax.scatter(Px_cuml[indices], x[indices], lw=0, c='k', s=9)
ax.plot(Px_cuml_sample, x_sample, '-k')
ax.arrow(0.7, -3, 0, 3.5, width=0.015, fc='gray', ec='gray',
         head_width=0.05, head_length=0.4)
ax.arrow(0.7, 0.9, -0.69, 0, width=0.1, fc='gray', ec='gray',
         head_width=0.3, head_length=0.06)
ax.set_xlim(-0.05, 1.05)
ax.set_ylim(-3, 3)
ax.set_title('Inverse Cuml. Distribution')
ax.set_xlabel('$p(<x)$')
ax.set_ylabel('$x$')

# plot the resulting cloned distribution
ax = fig.add_subplot(224)
hist(x, bins='knuth', ax=ax,
     histtype='stepfilled', density=True,
     ec='#AAAAAA', fc='#DDDDDD',
     label='input data')
hist(x_cloned, bins='knuth', ax=ax,
     histtype='step', density=True,
     color='k', label='cloned data')
ax.set_title('Cloned Distribution')
ax.set_xlabel('$x$')
ax.set_ylabel('$p(x)dx$')
ax.text(0.74, 0.95, "KS test:\nD = %.2f\np = %.2f" % (D, p),
        ha='left', va='top', transform=ax.transAxes)

plt.show()