Phased LINEAR Light Curve
Figure 10.17
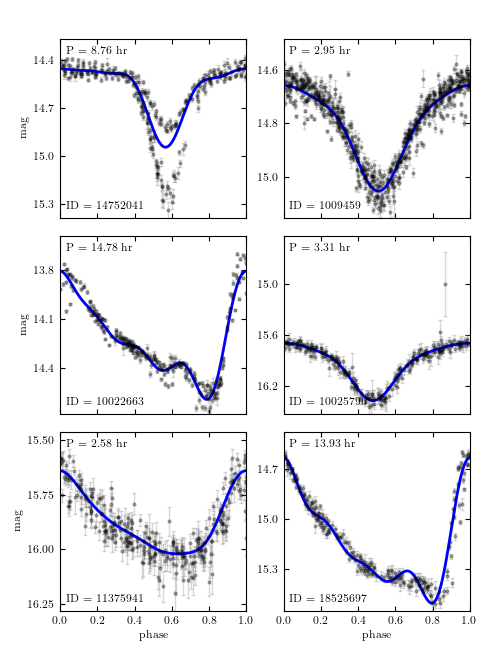
Phased light curves for six of the periodic objects from the LINEAR data set. The lines show the best fit to the phased light curve using the first four terms of the Fourier expansion (eq. 10.68), with the omega_0 selected using the Lomb-Scargle periodogram.
@pickle_results: computing results and saving to 'LINEAR_LS.pkl'
 - computing power for 14752041 (253 points)
 - computing power for 1009459 (593 points)
 - computing power for 10022663 (246 points)
 - computing power for 10025796 (233 points)
 - computing power for 11375941 (280 points)
 - computing power for 18525697 (211 points)
 - omega_0 = 17.21695506
 - omega_0 = 51.10600808
 - omega_0 = 10.20062676
 - omega_0 = 45.55493503
 - omega_0 = 58.44512277
 - omega_0 = 10.82722772
# Author: Jake VanderPlas
# License: BSD
#   The figure produced by this code is published in the textbook
#   "Statistics, Data Mining, and Machine Learning in Astronomy" (2013)
#   For more information, see http://astroML.github.com
#   To report a bug or issue, use the following forum:
#    https://groups.google.com/forum/#!forum/astroml-general
from __future__ import print_function, division

import numpy as np
from matplotlib import pyplot as plt

from astroML.utils.decorators import pickle_results
from astroML.time_series import search_frequencies, lomb_scargle, MultiTermFit
from astroML.datasets import fetch_LINEAR_sample

#----------------------------------------------------------------------
# This function adjusts matplotlib settings for a uniform feel in the textbook.
# Note that with usetex=True, fonts are rendered with LaTeX.  This may
# result in an error if LaTeX is not installed on your system.  In that case,
# you can set usetex to False.
if "setup_text_plots" not in globals():
    from astroML.plotting import setup_text_plots
setup_text_plots(fontsize=8, usetex=True)
import matplotlib
matplotlib.rc('_internal', classic_mode=True)

#------------------------------------------------------------
# Load the dataset
data = fetch_LINEAR_sample()
ids = [14752041, 1009459, 10022663, 10025796, 11375941, 18525697]


#------------------------------------------------------------
# Compute the best frequencies
@pickle_results('LINEAR_LS.pkl')
def compute_best_frequencies(ids, n_eval=10000, n_retry=5, generalized=True):
    results = {}
    for i in ids:
        t, y, dy = data[i].T
        print(" - computing power for {0} ({1} points)".format(i, len(t)))
        kwargs = dict(generalized=generalized)
        omega, power = search_frequencies(t, y, dy, n_eval=n_eval,
                                          n_retry=n_retry,
                                          LS_kwargs=kwargs)
        results[i] = [omega, power]

    return results

results = compute_best_frequencies(ids, n_eval=10000, n_retry=5)

#------------------------------------------------------------
# Plot the phased light-curves
fig = plt.figure(figsize=(5, 6.5))
fig.subplots_adjust(hspace=0.1, bottom=0.06, top=0.94, left=0.12, right=0.94)

for i in range(6):
    # get the data and best-fit angular frequency
    t, y, dy = data[ids[i]].T
    omega, power = results[ids[i]]
    omega_best = omega[np.argmax(power)]
    print(" - omega_0 = %.10g" % omega_best)

    # do a fit to the first 4 Fourier components
    mtf = MultiTermFit(omega_best, 4)
    mtf.fit(t, y, dy)
    phase_fit, y_fit, phased_t = mtf.predict(1000, return_phased_times=True)

    # plot the phased data and best-fit curves
    ax = fig.add_subplot(321 + i)
    ax.errorbar(phased_t, y, dy, fmt='.k', ecolor='gray',
                lw=1, ms=4, capsize=1.5, alpha=0.3)
    ax.plot(phase_fit, y_fit, 'b', markeredgecolor='b', lw=2, fillstyle='top', linestyle='solid')

    ax.set_xlim(0, 1)
    ax.set_ylim(plt.ylim()[::-1])
    ax.yaxis.set_major_locator(plt.MaxNLocator(4))

    ax.text(0.03, 0.04, "ID = %i" % ids[i], ha='left', va='bottom',
            transform=ax.transAxes)
    ax.text(0.03, 0.96, "P = %.2f hr" % (2 * np.pi / omega_best * 24.),
            ha='left', va='top',
            transform=ax.transAxes)

    ylim = ax.get_ylim()
    ax.set_ylim(ylim[0], ylim[0] + 1.1 * (ylim[1] - ylim[0]))

    if i < 4:
        ax.xaxis.set_major_formatter(plt.NullFormatter())
    if i % 2 == 0:
        ax.set_ylabel('mag')

    if i in (4, 5):
        ax.set_xlabel('phase')

plt.show()