Broadcast Visualization
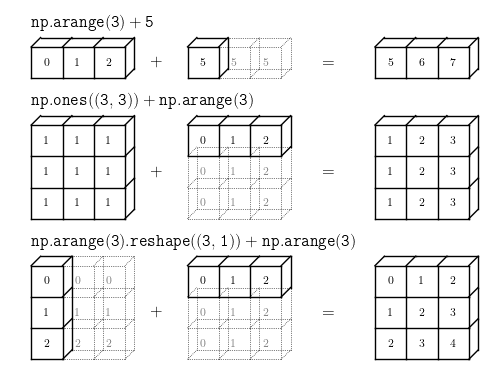
Figure A.1
A visualization of NumPy array broadcasting. Note that the extra memory indicated by the dotted boxes is never allocated, but it can be convenient to think about the operations as if it is.
# Author: Jake VanderPlas
# License: BSD
#   The figure produced by this code is published in the textbook
#   "Statistics, Data Mining, and Machine Learning in Astronomy" (2013)
#   For more information, see http://astroML.github.com
#   To report a bug or issue, use the following forum:
#    https://groups.google.com/forum/#!forum/astroml-general
import numpy as np
from matplotlib import pyplot as plt

#----------------------------------------------------------------------
# This function adjusts matplotlib settings for a uniform feel in the textbook.
# Note that with usetex=True, fonts are rendered with LaTeX.  This may
# result in an error if LaTeX is not installed on your system.  In that case,
# you can set usetex to False.
if "setup_text_plots" not in globals():
    from astroML.plotting import setup_text_plots
setup_text_plots(fontsize=8, usetex=True)

#------------------------------------------------------------
# Draw a figure and axis with no boundary
fig = plt.figure(figsize=(5, 3.75), facecolor='w')
ax = plt.axes([0, 0, 1, 1], xticks=[], yticks=[], frameon=False)


def draw_cube(ax, xy, size, depth=0.4,
              edges=None, label=None, label_kwargs=None, **kwargs):
    """draw and label a cube.  edges is a list of numbers between
    1 and 12, specifying which of the 12 cube edges to draw"""
    if edges is None:
        edges = range(1, 13)

    x, y = xy

    if 1 in edges:
        ax.plot([x, x + size],
                [y + size, y + size], **kwargs)
    if 2 in edges:
        ax.plot([x + size, x + size],
                [y, y + size], **kwargs)
    if 3 in edges:
        ax.plot([x, x + size],
                [y, y], **kwargs)
    if 4 in edges:
        ax.plot([x, x],
                [y, y + size], **kwargs)

    if 5 in edges:
        ax.plot([x, x + depth],
                [y + size, y + depth + size], **kwargs)
    if 6 in edges:
        ax.plot([x + size, x + size + depth],
                [y + size, y + depth + size], **kwargs)
    if 7 in edges:
        ax.plot([x + size, x + size + depth],
                [y, y + depth], **kwargs)
    if 8 in edges:
        ax.plot([x, x + depth],
                [y, y + depth], **kwargs)

    if 9 in edges:
        ax.plot([x + depth, x + depth + size],
                [y + depth + size, y + depth + size], **kwargs)
    if 10 in edges:
        ax.plot([x + depth + size, x + depth + size],
                [y + depth, y + depth + size], **kwargs)
    if 11 in edges:
        ax.plot([x + depth, x + depth + size],
                [y + depth, y + depth], **kwargs)
    if 12 in edges:
        ax.plot([x + depth, x + depth],
                [y + depth, y + depth + size], **kwargs)

    if label:
        if label_kwargs is None:
            label_kwargs = {}
        ax.text(x + 0.5 * size, y + 0.5 * size, label,
                ha='center', va='center', **label_kwargs)

solid = dict(c='black', ls='-', lw=1,
             label_kwargs=dict(color='k'))
dotted = dict(c='black', ls=':', lw=0.5,
              label_kwargs=dict(color='gray'))
depth = 0.3

#------------------------------------------------------------
# Draw top operation: vector plus scalar
draw_cube(ax, (1, 10), 1, depth, [1, 2, 3, 4, 5, 6, 9], '0', **solid)
draw_cube(ax, (2, 10), 1, depth, [1, 2, 3, 6, 9], '1', **solid)
draw_cube(ax, (3, 10), 1, depth, [1, 2, 3, 6, 7, 9, 10], '2', **solid)

draw_cube(ax, (6, 10), 1, depth, [1, 2, 3, 4, 5, 6, 7, 9, 10], '5', **solid)
draw_cube(ax, (7, 10), 1, depth, [1, 2, 3, 6, 7, 9, 10, 11], '5', **dotted)
draw_cube(ax, (8, 10), 1, depth, [1, 2, 3, 6, 7, 9, 10, 11], '5', **dotted)

draw_cube(ax, (12, 10), 1, depth, [1, 2, 3, 4, 5, 6, 9], '5', **solid)
draw_cube(ax, (13, 10), 1, depth, [1, 2, 3, 6, 9], '6', **solid)
draw_cube(ax, (14, 10), 1, depth, [1, 2, 3, 6, 7, 9, 10], '7', **solid)

ax.text(5, 10.5, '+', size=12, ha='center', va='center')
ax.text(10.5, 10.5, '=', size=12, ha='center', va='center')
ax.text(1, 11.5, r'${\tt np.arange(3) + 5}$',
        size=12, ha='left', va='bottom')

#------------------------------------------------------------
# Draw middle operation: matrix plus vector

# first block
draw_cube(ax, (1, 7.5), 1, depth, [1, 2, 3, 4, 5, 6, 9], '1', **solid)
draw_cube(ax, (2, 7.5), 1, depth, [1, 2, 3, 6, 9], '1', **solid)
draw_cube(ax, (3, 7.5), 1, depth, [1, 2, 3, 6, 7, 9, 10], '1', **solid)

draw_cube(ax, (1, 6.5), 1, depth, [2, 3, 4], '1', **solid)
draw_cube(ax, (2, 6.5), 1, depth, [2, 3], '1', **solid)
draw_cube(ax, (3, 6.5), 1, depth, [2, 3, 7, 10], '1', **solid)

draw_cube(ax, (1, 5.5), 1, depth, [2, 3, 4], '1', **solid)
draw_cube(ax, (2, 5.5), 1, depth, [2, 3], '1', **solid)
draw_cube(ax, (3, 5.5), 1, depth, [2, 3, 7, 10], '1', **solid)

# second block
draw_cube(ax, (6, 7.5), 1, depth, [1, 2, 3, 4, 5, 6, 9], '0', **solid)
draw_cube(ax, (7, 7.5), 1, depth, [1, 2, 3, 6, 9], '1', **solid)
draw_cube(ax, (8, 7.5), 1, depth, [1, 2, 3, 6, 7, 9, 10], '2', **solid)

draw_cube(ax, (6, 6.5), 1, depth, range(2, 13), '0', **dotted)
draw_cube(ax, (7, 6.5), 1, depth, [2, 3, 6, 7, 9, 10, 11], '1', **dotted)
draw_cube(ax, (8, 6.5), 1, depth, [2, 3, 6, 7, 9, 10, 11], '2', **dotted)

draw_cube(ax, (6, 5.5), 1, depth, [2, 3, 4, 7, 8, 10, 11, 12], '0', **dotted)
draw_cube(ax, (7, 5.5), 1, depth, [2, 3, 7, 10, 11], '1', **dotted)
draw_cube(ax, (8, 5.5), 1, depth, [2, 3, 7, 10, 11], '2', **dotted)

# third block
draw_cube(ax, (12, 7.5), 1, depth, [1, 2, 3, 4, 5, 6, 9], '1', **solid)
draw_cube(ax, (13, 7.5), 1, depth, [1, 2, 3, 6, 9], '2', **solid)
draw_cube(ax, (14, 7.5), 1, depth, [1, 2, 3, 6, 7, 9, 10], '3', **solid)

draw_cube(ax, (12, 6.5), 1, depth, [2, 3, 4], '1', **solid)
draw_cube(ax, (13, 6.5), 1, depth, [2, 3], '2', **solid)
draw_cube(ax, (14, 6.5), 1, depth, [2, 3, 7, 10], '3', **solid)

draw_cube(ax, (12, 5.5), 1, depth, [2, 3, 4], '1', **solid)
draw_cube(ax, (13, 5.5), 1, depth, [2, 3], '2', **solid)
draw_cube(ax, (14, 5.5), 1, depth, [2, 3, 7, 10], '3', **solid)

ax.text(5, 7.0, '+', size=12, ha='center', va='center')
ax.text(10.5, 7.0, '=', size=12, ha='center', va='center')
ax.text(1, 9.0, r'${\tt np.ones((3,\, 3)) + np.arange(3)}$',
        size=12, ha='left', va='bottom')

#------------------------------------------------------------
# Draw bottom operation: vector plus vector, double broadcast

# first block
draw_cube(ax, (1, 3), 1, depth, [1, 2, 3, 4, 5, 6, 7, 9, 10], '0', **solid)
draw_cube(ax, (1, 2), 1, depth, [2, 3, 4, 7, 10], '1', **solid)
draw_cube(ax, (1, 1), 1, depth, [2, 3, 4, 7, 10], '2', **solid)

draw_cube(ax, (2, 3), 1, depth, [1, 2, 3, 6, 7, 9, 10, 11], '0', **dotted)
draw_cube(ax, (2, 2), 1, depth, [2, 3, 7, 10, 11], '1', **dotted)
draw_cube(ax, (2, 1), 1, depth, [2, 3, 7, 10, 11], '2', **dotted)

draw_cube(ax, (3, 3), 1, depth, [1, 2, 3, 6, 7, 9, 10, 11], '0', **dotted)
draw_cube(ax, (3, 2), 1, depth, [2, 3, 7, 10, 11], '1', **dotted)
draw_cube(ax, (3, 1), 1, depth, [2, 3, 7, 10, 11], '2', **dotted)

# second block
draw_cube(ax, (6, 3), 1, depth, [1, 2, 3, 4, 5, 6, 9], '0', **solid)
draw_cube(ax, (7, 3), 1, depth, [1, 2, 3, 6, 9], '1', **solid)
draw_cube(ax, (8, 3), 1, depth, [1, 2, 3, 6, 7, 9, 10], '2', **solid)

draw_cube(ax, (6, 2), 1, depth, range(2, 13), '0', **dotted)
draw_cube(ax, (7, 2), 1, depth, [2, 3, 6, 7, 9, 10, 11], '1', **dotted)
draw_cube(ax, (8, 2), 1, depth, [2, 3, 6, 7, 9, 10, 11], '2', **dotted)

draw_cube(ax, (6, 1), 1, depth, [2, 3, 4, 7, 8, 10, 11, 12], '0', **dotted)
draw_cube(ax, (7, 1), 1, depth, [2, 3, 7, 10, 11], '1', **dotted)
draw_cube(ax, (8, 1), 1, depth, [2, 3, 7, 10, 11], '2', **dotted)

# third block
draw_cube(ax, (12, 3), 1, depth, [1, 2, 3, 4, 5, 6, 9], '0', **solid)
draw_cube(ax, (13, 3), 1, depth, [1, 2, 3, 6, 9], '1', **solid)
draw_cube(ax, (14, 3), 1, depth, [1, 2, 3, 6, 7, 9, 10], '2', **solid)

draw_cube(ax, (12, 2), 1, depth, [2, 3, 4], '1', **solid)
draw_cube(ax, (13, 2), 1, depth, [2, 3], '2', **solid)
draw_cube(ax, (14, 2), 1, depth, [2, 3, 7, 10], '3', **solid)

draw_cube(ax, (12, 1), 1, depth, [2, 3, 4], '2', **solid)
draw_cube(ax, (13, 1), 1, depth, [2, 3], '3', **solid)
draw_cube(ax, (14, 1), 1, depth, [2, 3, 7, 10], '4', **solid)

ax.text(5, 2.5, '+', size=12, ha='center', va='center')
ax.text(10.5, 2.5, '=', size=12, ha='center', va='center')
ax.text(1, 4.5, r'${\tt np.arange(3).reshape((3,\, 1)) + np.arange(3)}$',
        ha='left', size=12, va='bottom')

ax.set_xlim(0, 16)
ax.set_ylim(0.5, 12.5)
plt.show()